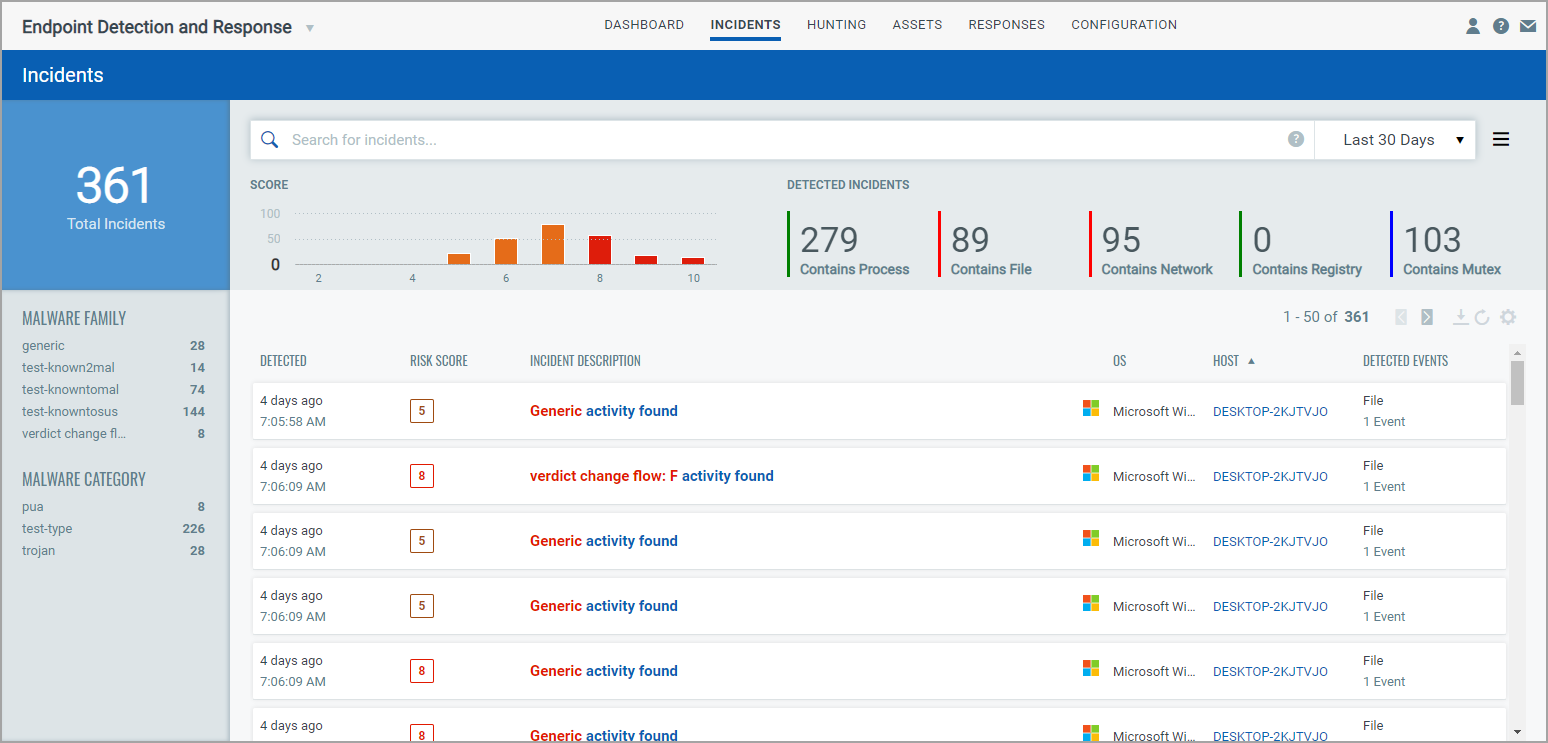
Investigate incidents for active threats by Malware name and malware family name. Here all the incidents detected on an asset are listed here. Know the OS and host on which the incident was detected, the events detected, and other information at quick glance.
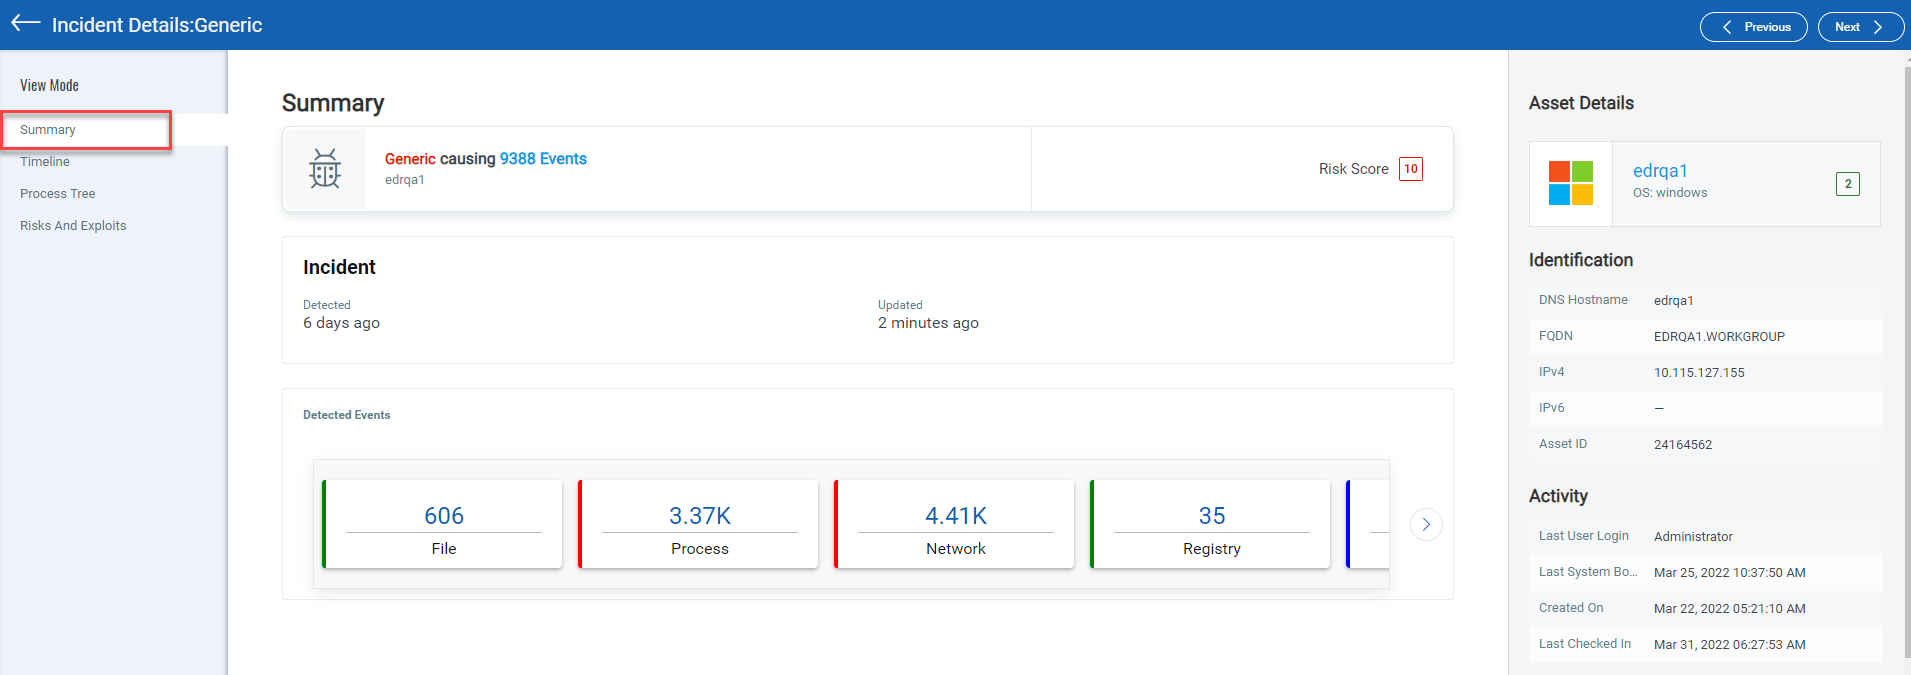
To know more about the incident, click on the incident description and in the Incidents Details, view information like Timeline, Process Tree, Asset Details etc. If the risk score is zero then the incident is considered non malicious.
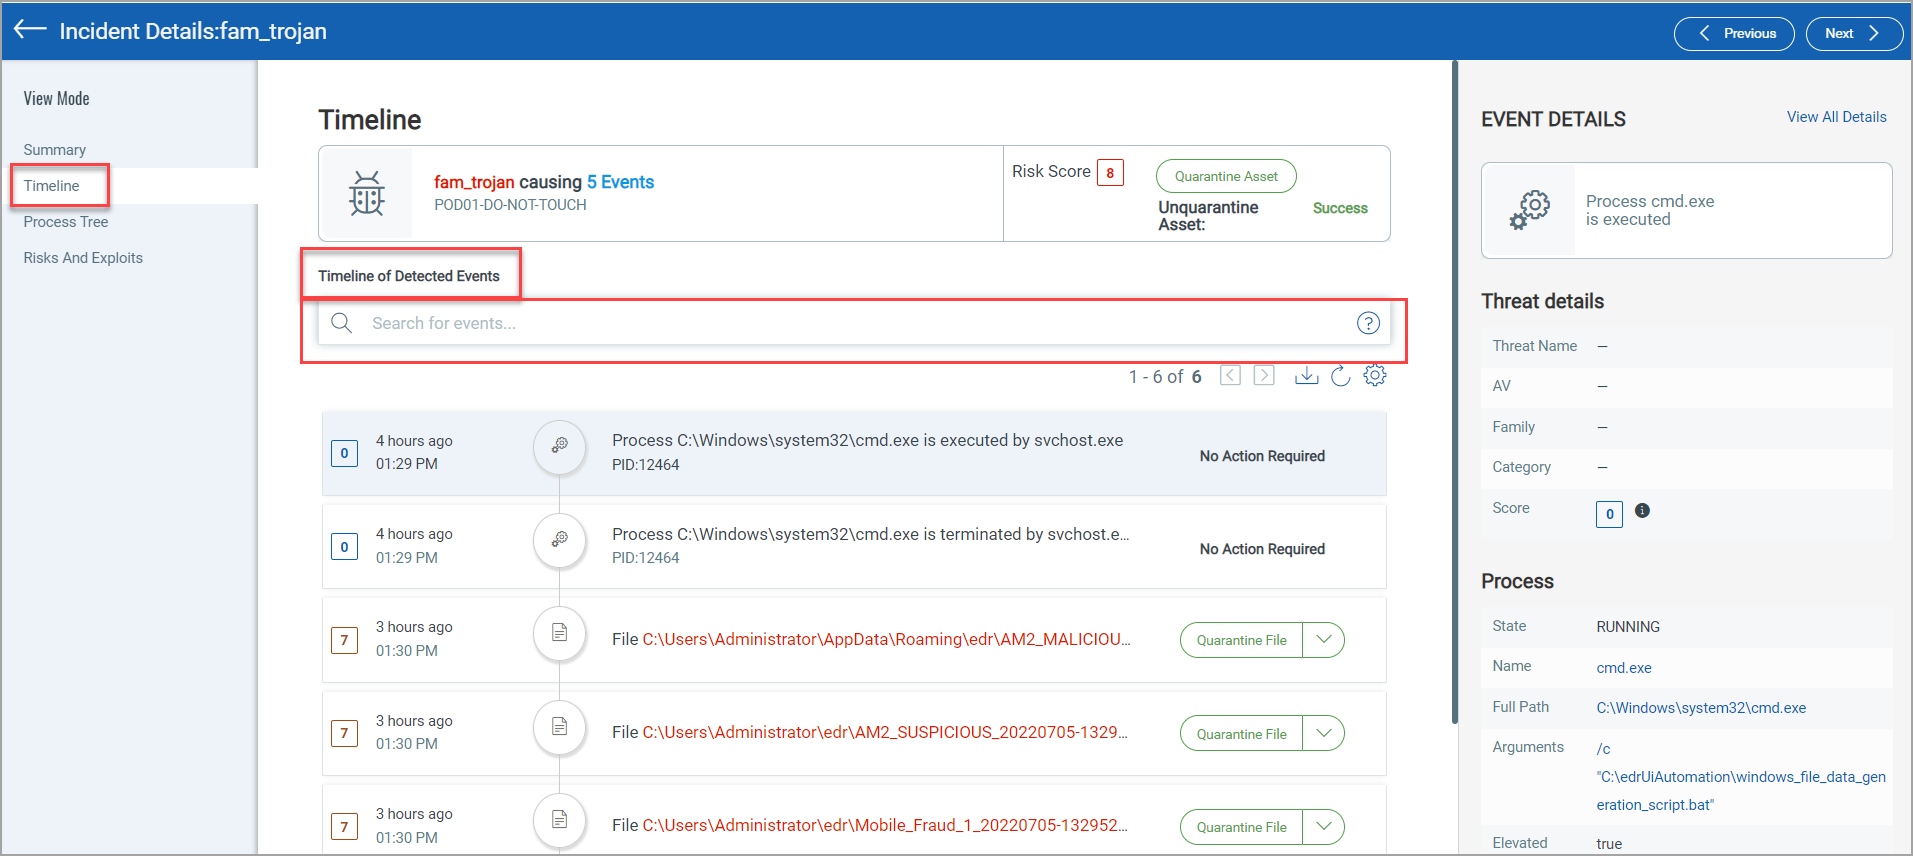
You can also remediate incidents from the Incident Details. Navigate to the Timeline tab to view the detected event. Alternatively, you can search for the detected events from the Search for events search bar using the Events Search Token and choose a remediation action if applicable.
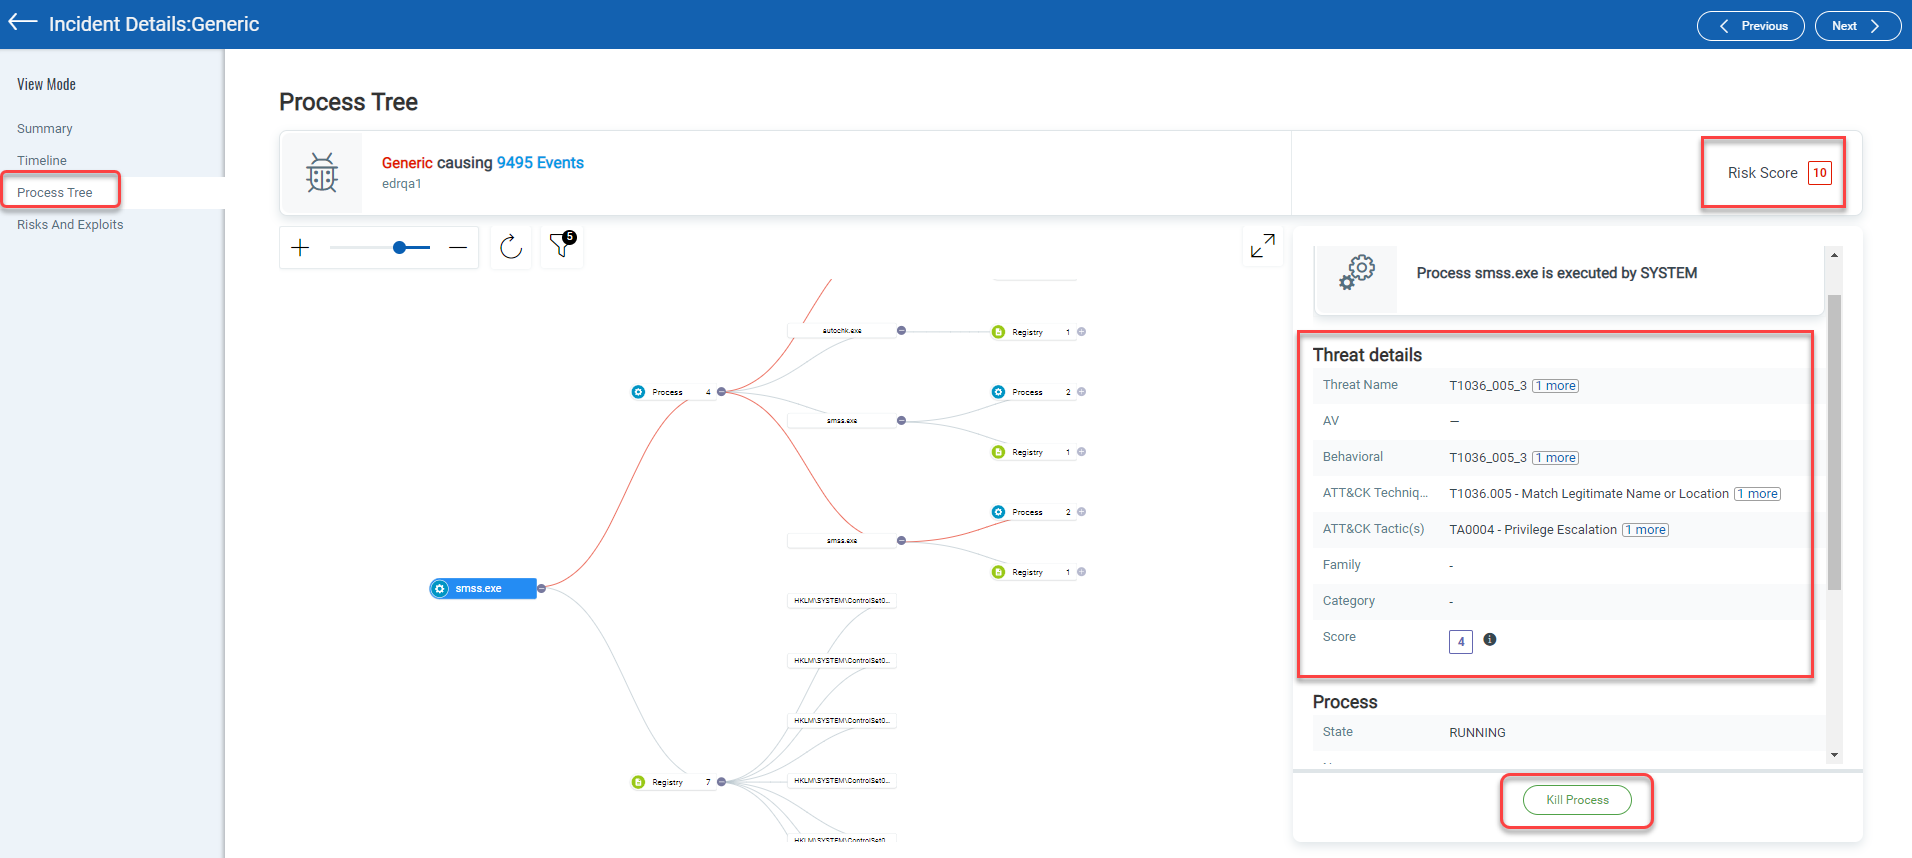
You can also take remediation action from the Process tree tab. The process tree displays all the related events of the selected incident.
An event of the “Process” type will show its parent and child processes along with the mutex and network connection of the process.
In the process tree view, you can traverse between the nodes by clicking a node in the hierarchy. You can click on the (+) and (-) to expand and collapse the tree nodes and display the related events.
You can click on the event node to view the details of the selected node in the right pane. To help you identify event types of nodes in a hierarchy view, similar events are grouped under an event type (example: Mutex or Network) and respective event icons are added against the node.
You can view the detection engine (Malware Detection, Yara rules, Behavioral Analysis, Threat Intelligence, etc.) for the event and the event risk score in the Threat details section.
Process tree view displays a zoom bar and reset option. You can use the filter to view a specific event type in the process tree. The Process event will always be visible.
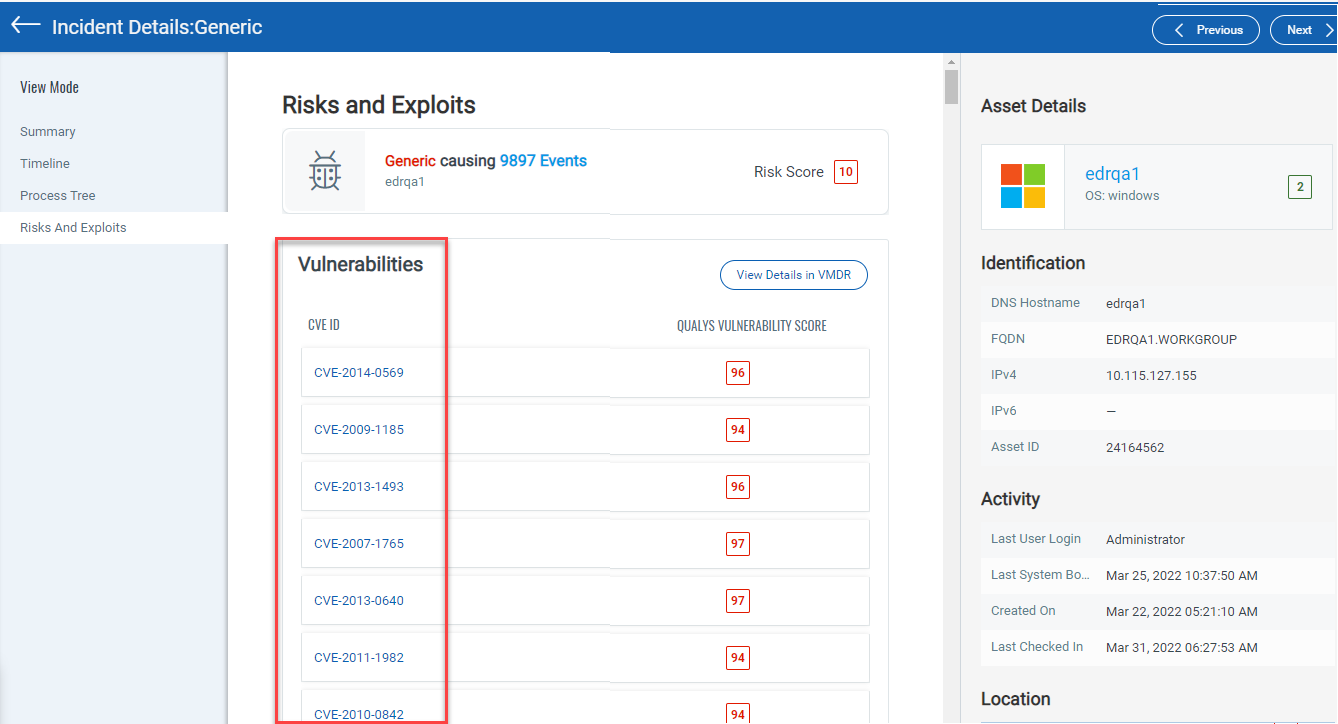
Click the Risks and Exploits tab to view the vulnerabilities linked to the incident. If you have a subscription for the VMDR application, you can view the vulnerability details.
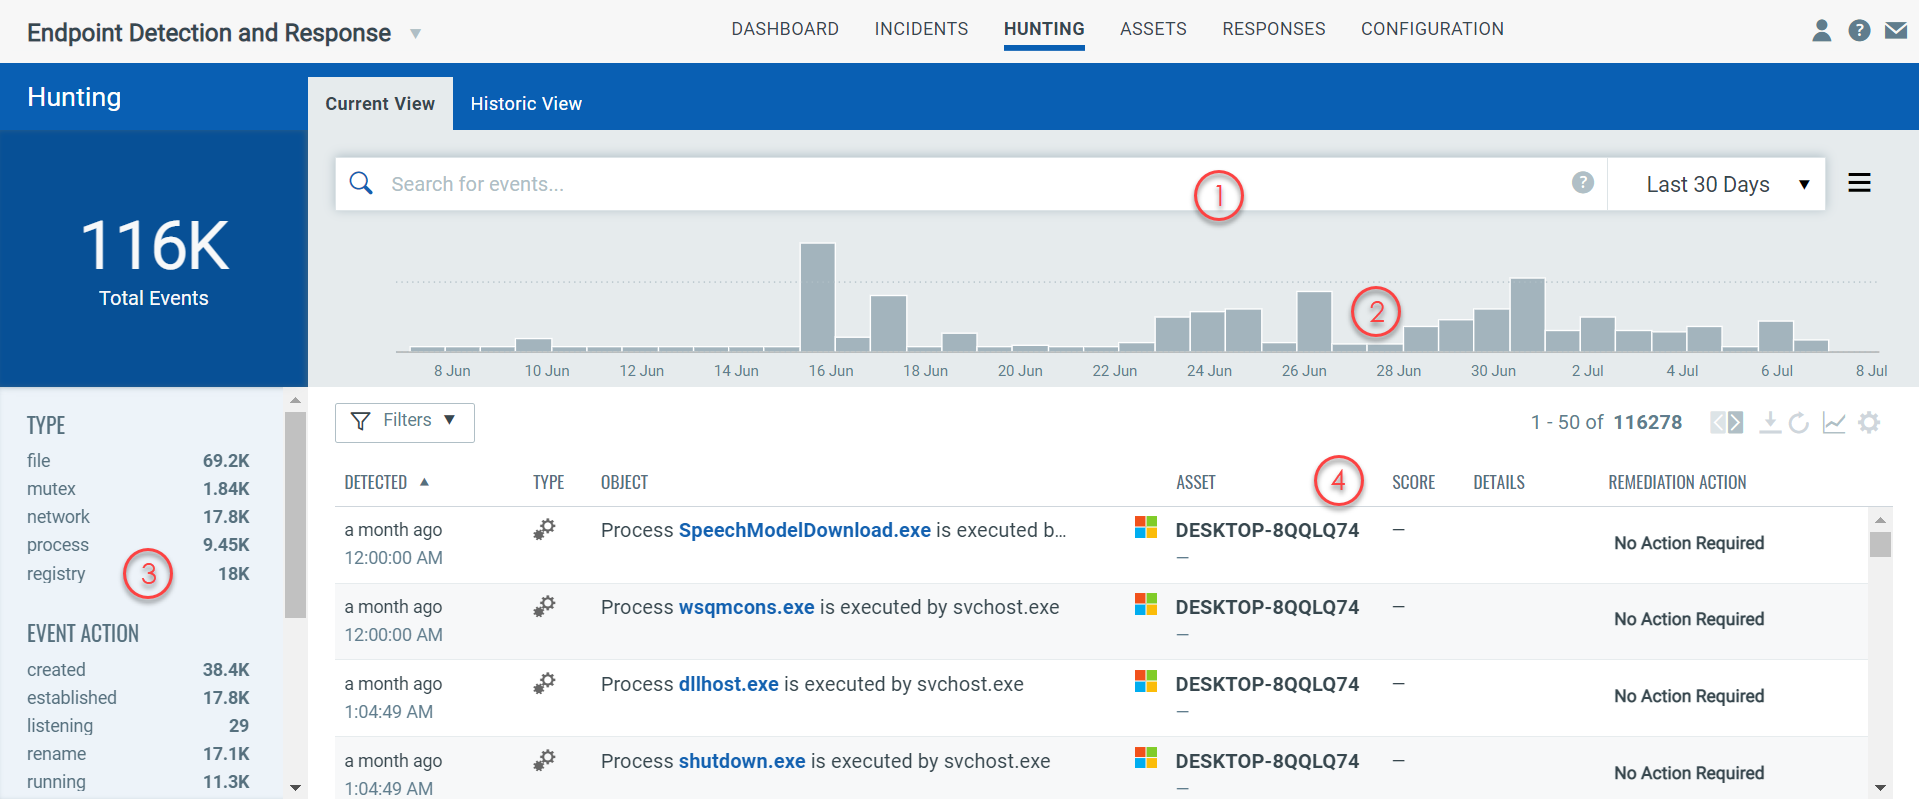
The Hunting tab, has the following two sub tabs:
- Current View: This tab lists all the events that are active on the assets.
- Historic View: This tab list all the events registered and executed on the asset.
Search for events by event properties (1), jump to events that occurred in certain time frame (2), group events by type (3), view event details and asset details (4).
The Event Details page lists more information for each event. Know more
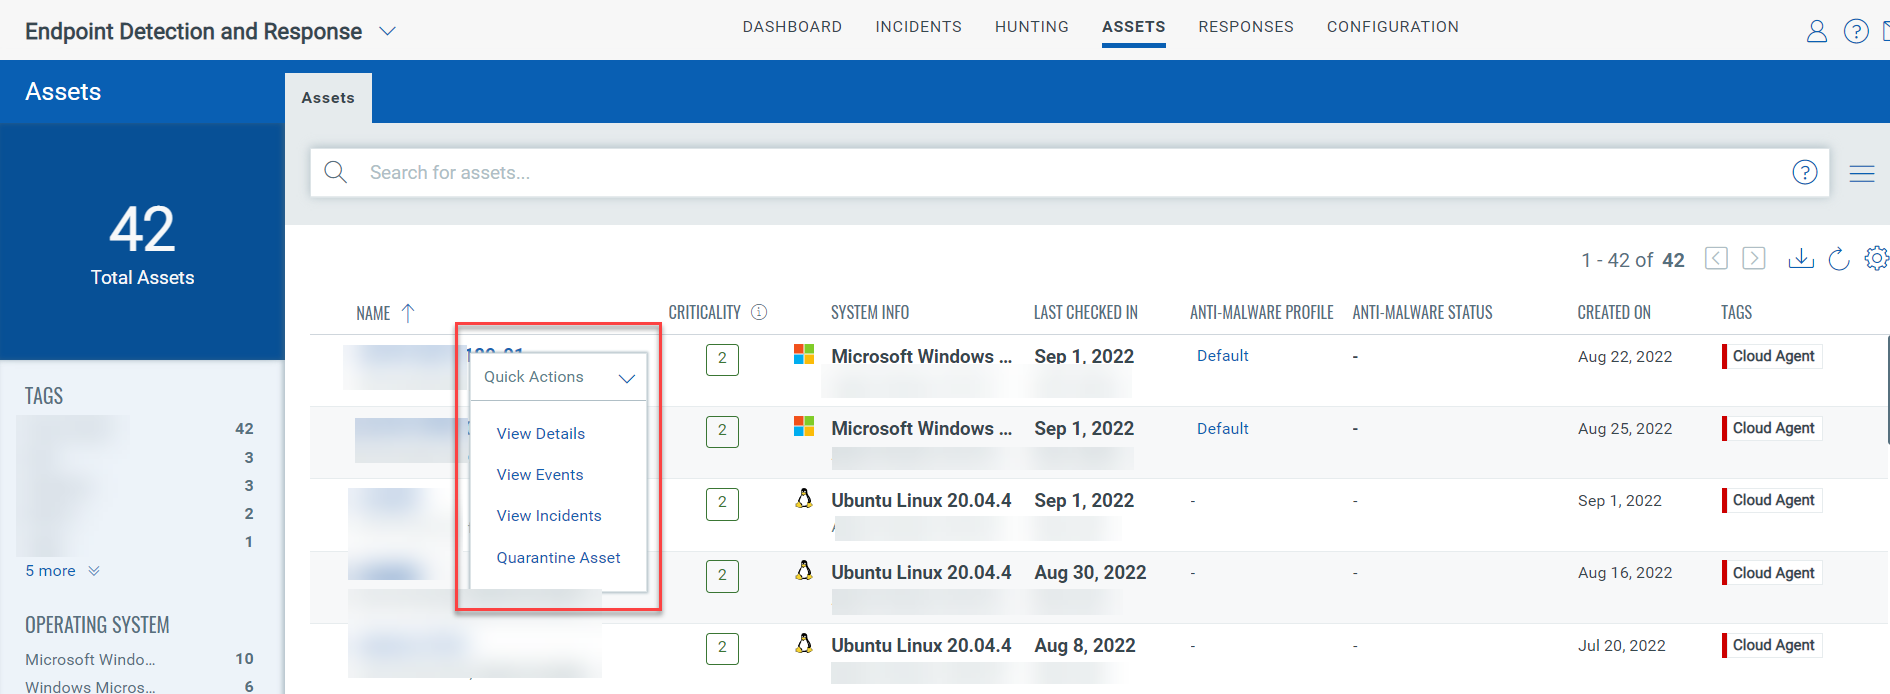
Get up to date views on a selected asset's details, its events and incidents. Using the Quick action menu, view the Asset Details. Event Details, and Incident details.
In the Assets window, you can view the Operating System and the Agent version in the System Info column. The Tags column is the newly added column in the Asset window.