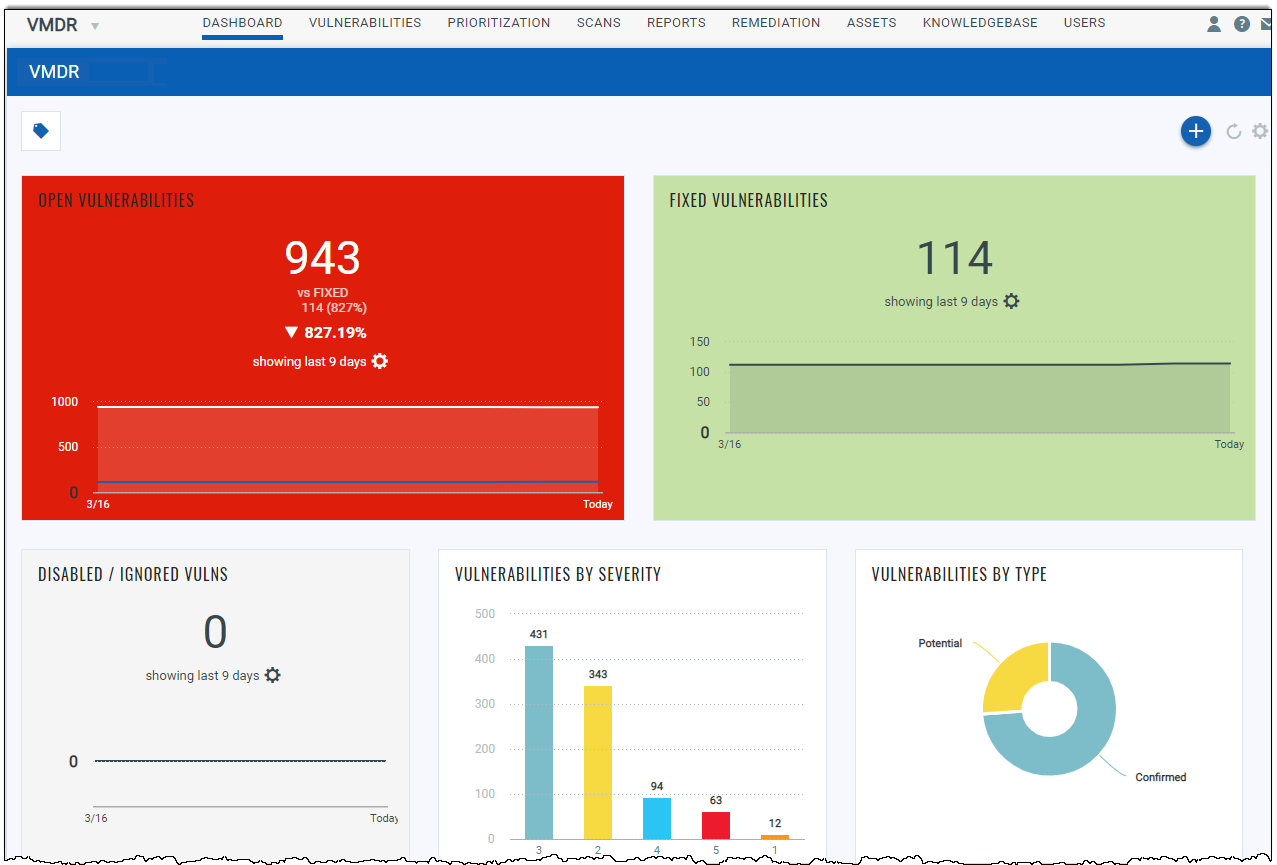
You can use the Qualys provided VMDR dashboard to view your vulnerabilities posture. You can create multiple dashboards and switch between them. Each dashboard has a collection of widgets showing asset data of interest. Use the Actions menu to manage your dashboards.

1) Start by clicking the Add Widget button on your dashboard.
2) Pick one of our widget templates - there are many to choose from - or create your own.
3) Each widget is unique. For some you'll select asset data, a query and layout - count, table, bar graph, pie chart.
4) From the Actions menu you can also import and export widget configurations to a file in a json format, allowing you to share the widgets between accounts or within the Qualys community.
Tip Wondering how we created the widgets on the default dashboard? Choose Action > Configure Widget to see the settings.
Resize any widget vertically or horizontally, drag & drop widgets on the page to change the layout. Show me
You might want to see the latest asset data for a widget. Just select the label to the right of the widget title and select Refresh Widget from the widget menu. Show me
To refresh all widgets in one go, simple click xxx (Refresh All) on the dashboard and all your widgets will be refreshed. Show me
Sure, you have multiple ways to configure a table in a widget to help you visualize your assets and their security. Create tables with multiple columns sort by any column you like or set the sort order (ascending or descending) Show me
Yes, you can configure dashboard count widgets to display trend data. Enable the Collect trend data option in the dynamic widget wizard. Once enabled, the widget trend data is collected daily and stored for up to 90 days. This is used to plot a line graph in the count widget. Show me